Fracture Toughness in Aggressive Environments: Effect of Crack Monitoring Techniques on Test Results
TWI Industrial Member Report 1194-2024 [pdf / 13,116KB]
By Fokion OikonomidisCEng, PhD, MBA, MEng (Hons), BScTech
Industrial Need
This project originated from the industry requirement to generate accurate fracture toughness data in aggressive environments. Fracture toughness is the resistance of materials to a crack propagating under load, potentially leading to catastrophic failure. In aggressive environments, the fracture toughness of metals can be significantly reduced. Quantifying this reduction in fracture toughness is very important to industries that operate structures in aggressive environments. For instance, CMn based materials that are subjected to seawater are prone to corrosion, unless some form of protection is implemented. Offshore oil and gas pipelines and related structures can be economically and consistently be protected from corrosion by applying cathodic protection (CP). Using active CP systems typically involves applying a small direct electrical charge to the material. However, one of the main drawbacks of this method is that the fracture toughness of the material deteriorates. The main mechanism of such deterioration is the diffusion of hydrogen atoms from the surrounding seawater towards the main body of the CMn material. The metal thus becomes susceptible to hydrogen embrittlement.
Understanding the gravity of hydrogen embrittlement in the reduction of fracture toughness is typically done by extracting small specimens from the material and testing under laboratory conditions that simulate the real-life environmental conditions as accurately as possible. During those tests, either tensile or bending forces are applied to a specimen that has a pre-manufactured sharp crack. The crack is extended and this crack growth is monitored in relation to the applied loads. To monitor the crack mouth opening and the extension of the crack under load, while the whole specimen is submerged in the aggressive environment, clip gauges can be used. Clip gauges are displacement transducers attached to the crack mouth. They convert the physical displacement of the crack mouth sides into electrical signal, which is recorded by a data logger and used for the crack related calculations. The use of clip gauges is limited in most aggressive environments, because it can be a great challenge to design them to survive the environmental conditions. For that reason, the use of direct current potential drop (DCPD) has been considered, as an alternative method. Using DCPD involves applying a direct current through the body of the specimen and measuring the voltage at its ends. When there is crack propagation in the specimen, the cross sectional area is reduced, increasing the resistance of the material, and causing a change in the current that passes through. Using DCPD for crack measurement can potentially overcome the challenges of environmental impact on the measuring device of fracture toughness testing.
Clip gauges and DCPD have been used as alternative crack measuring methods in this project. The clip gauges have been used with the unloading compliance (UC) fracture toughness testing method. The DCPD has been used in monotonically rising load application on specimens. The project focuses on the influence of either following the UC method or the DCPD based method on fracture toughness resistance (R-) curves generated in 3.5% NaCl deaerated water solution under CP. Compact tension (CT) and single edge notch bend (SENB) specimens have been extracted from the parent material of an F22-75k Low Alloy Steel forging. However, only the CT specimens have been tested due to lack of test machine availability for SENB specimens. The effect of K-rate on fracture toughness results generated in aggressive environments using both UC and DCPD techniques is also under investigation. Three stress intensity (K-) rates have been applied: Lo [0.005N/(mm1.5s)], Mid [0.01N/(mm1.5s)], and Hi [0.05N/(mm1.5s)]. An attempt has been made to understand the accuracy of the DCPD and UC methods near the onset of stable crack growth. The normalisation method has also been used for a number of specimens that utilised DCPD, as an alternative method of R-curve generation.
Key Findings
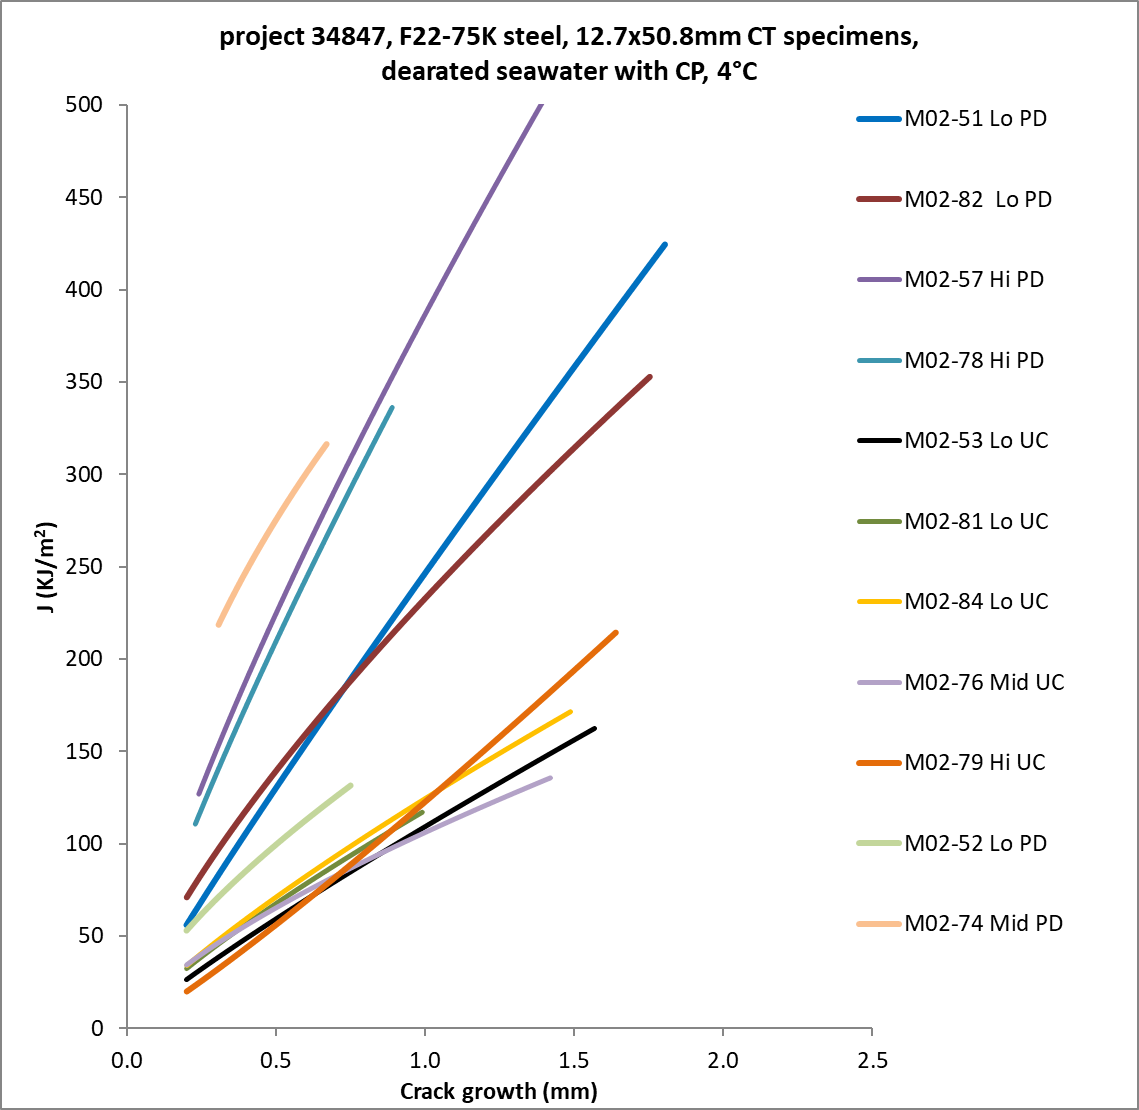
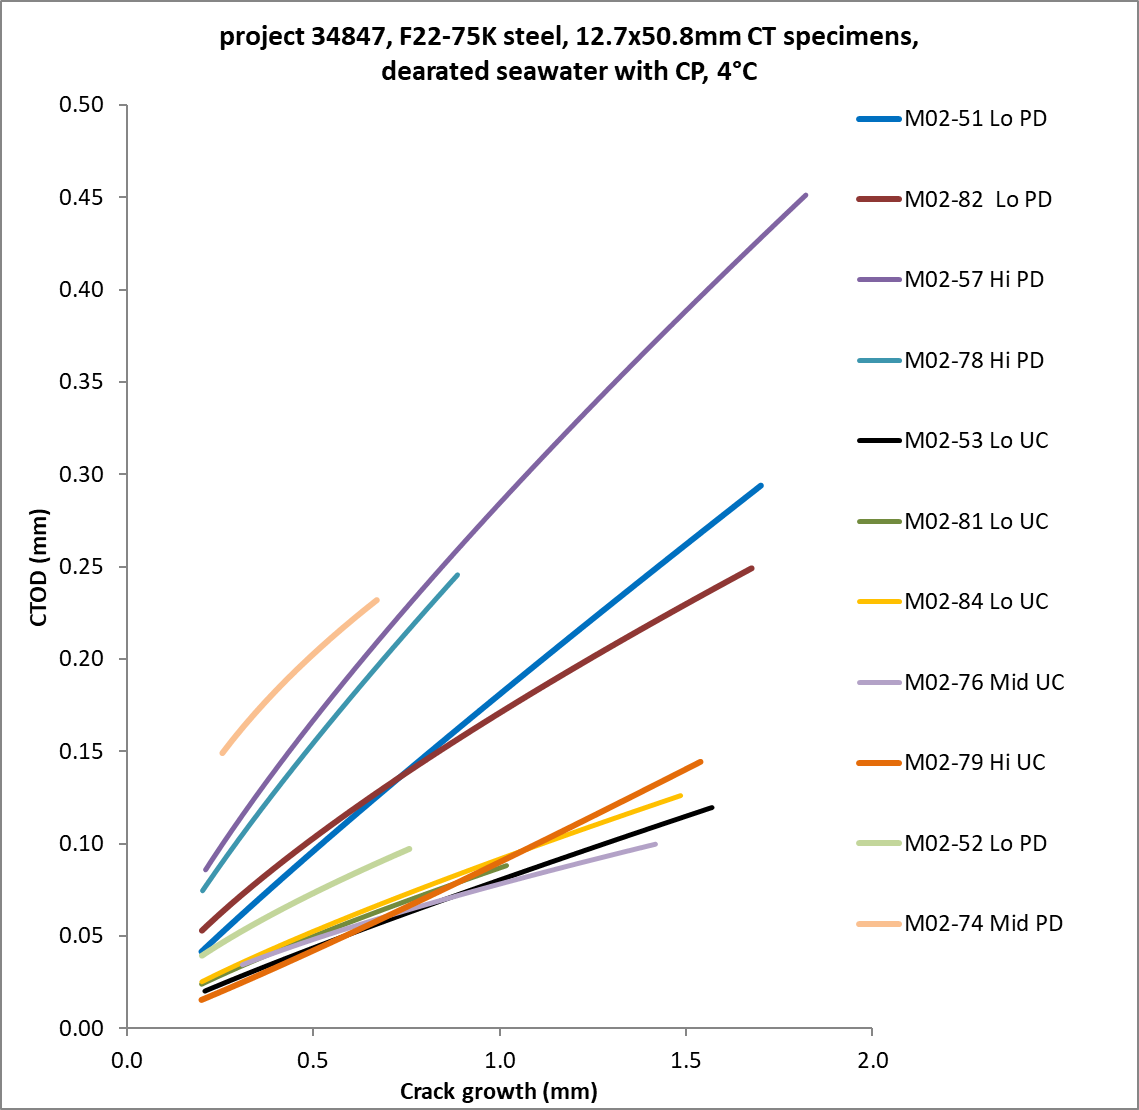
- The UC method has generated more conservative fracture toughness test results compared to the test method utilising DCPD, for each of the nominal K-rates applied
- The longer test duration and the slower secondary K-rate (tangent to curve connecting the points of maximum K on the graph of K versus time) in the UC testing method are considered to be the main factors leading to more conservative fracture toughness test results compared to those from the DCPD method
- All of the power law fitted R-curves were in very good agreement with the corresponding data points
- The R-curves generated from tests using DCPD were much more dispersed and sensitive to the applied nominal K-rates, compared to the R-curves generated from UC testing
- Based on the test results of this research, use of K-rates equal or lower than the Lo K-rate of 0.005N/(mm1.5s) is advisable for testing in seawater environment under CP for this material, mainly because the Lo K-rate has generated the most conservative fracture toughness results
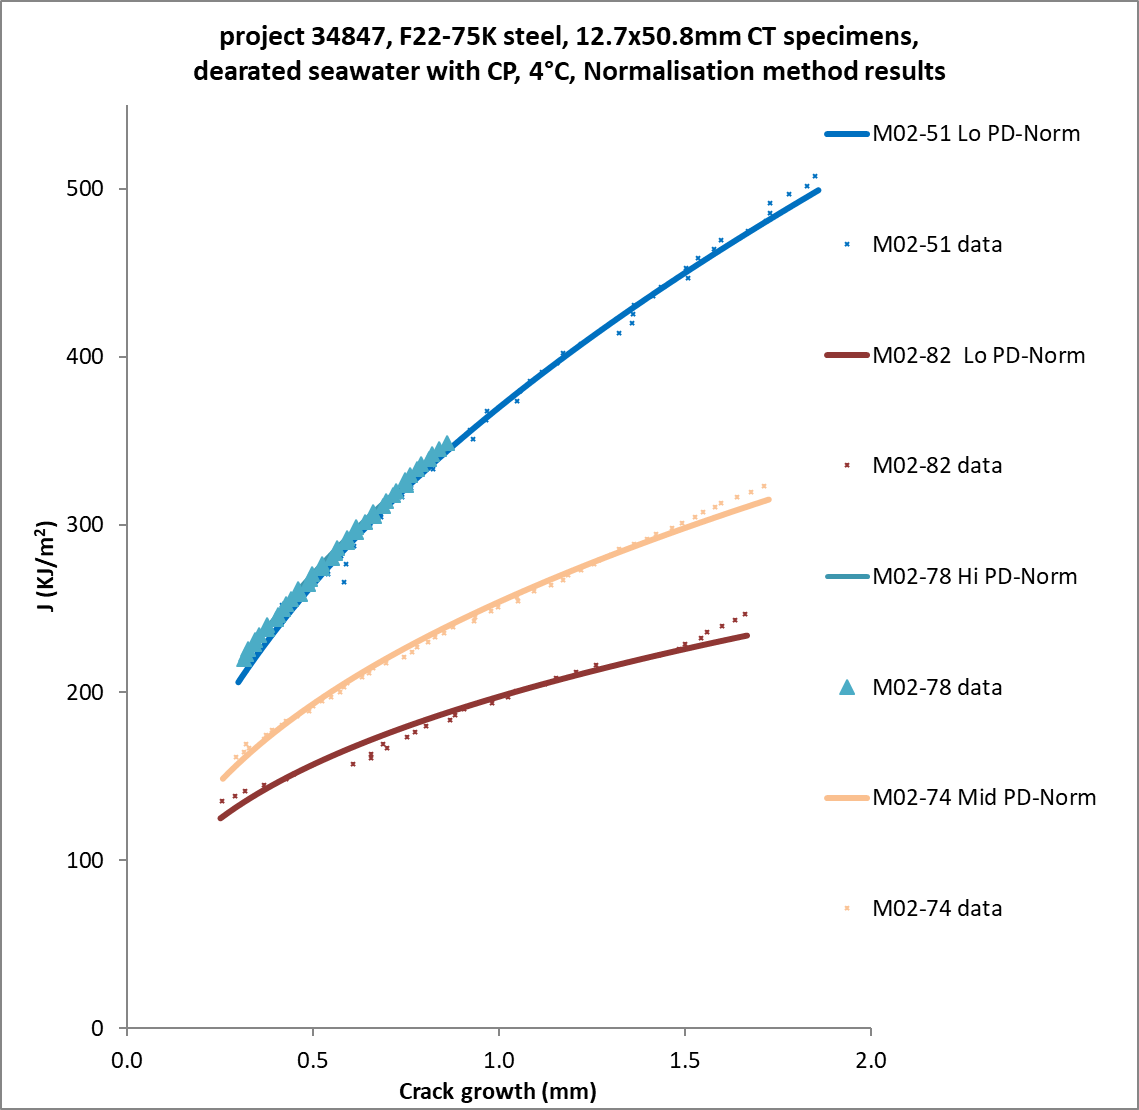
- The normalisation method has only generated comparable results to the originally generated R-curve testing using DCPD, at the Hi K-rate
- Investigating the mechanisms that contribute to the onset of stable crack extension requires many specimens to be used in a trial and error regime, to find the right point in time to stop the test and measure the actual crack on the fracture faces
Impact
All of the original objectives of the project have been met for CT specimens. It was not possible to conduct tests using SENB specimens due to unavailability of test machines. The scope of work for SENB specimens was replaced by testing additional CT specimens with an additional objective of investigating the crack initiation part of the test methods. This additional objective has been achieved, but further research on the topic is required in the future, due to the complexity of the topic and the associated technical challenges. An additional objective of investigating the effect of the normalisation method was completed successfully.

Comparison of fitted J R-curves using DCPD (PD) or unloading compliance (UC) methods. Actual test data points not included for simplification. Nominal K-rates used: Lo: 0.005N/(mm1.5s), Mid: 0.01N/(mm1.5s), Hi: 0.05N/(mm1.5s).

Comparison of fitted CTOD R-curves using DCPD (PD) or unloading compliance (UC) methods. Actual test data points not included for simplification. Nominal K-rates used: Lo: 0.005N/(mm1.5s), Mid: 0.01N/(mm1.5s), Hi: 0.05N/(mm1.5s).

Comparison of fitted J R-curves and associated data points using the normalisation method. Nominal K-rates used: Lo: 0.005N/(mm1.5s), Mid: 0.01N/(mm1.5s), Hi: 0.05N/(mm1.5s).